We are a small Episcopal Church on the banks of the Rappahannock in Port Royal, Virginia. We acknowledge that we gather on the traditional land of the first people of Port Royal, the Nandtaughtacund, and we respect and honor with gratitude the land itself, the legacy of the ancestors, and the life of the Rappahannock Tribe. Our mission statement is to do God’s Will in all that we do.

Village Harvest, Aug. 16, 2023

Tuesday, Aug. 15, 2023, the day before the Harvest is a work day. 3 main tasks:

This month for Wed’s distribution we had:

  • meat and fish (whole chickens, salmon or pork chops),
  • fresh vegetables ( lettuce, eggplant, corn)
  • canned goods (corn, string beans, pears, beef stew).
  • cooked chicken in packs

Read more

Village Harvest, July 2023 – A Quick Analysis

CLIENTS

For the first 7 months average clients are done from 88 to 79, a 10% reduction.

Clients increased from June from 65 to 72 in July.

Total clients served is 552 in 2023 vs. 617 in 2022, a 11% reduction.
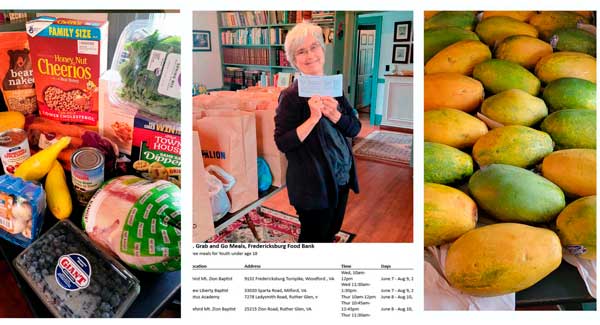
FOOD

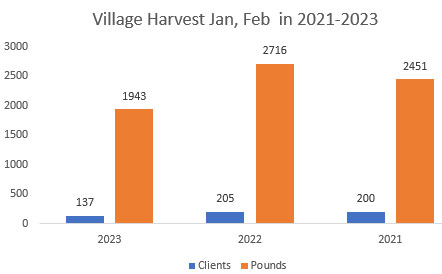
Total food is down from 8,844 pounds for first 7 months in 2022 to 7,576 in 2023, a 14% reduction.

Food at 1,206 was over June at 949. It was the second largest supply in 2023.

Pounds per person is 13.7 in 2023 first 7 months vs. 14.3 in 2022 for 7 months.

Considering just June to July, pounds per person, rose from 14.6 to 16.75, the second highest figure in 2023.
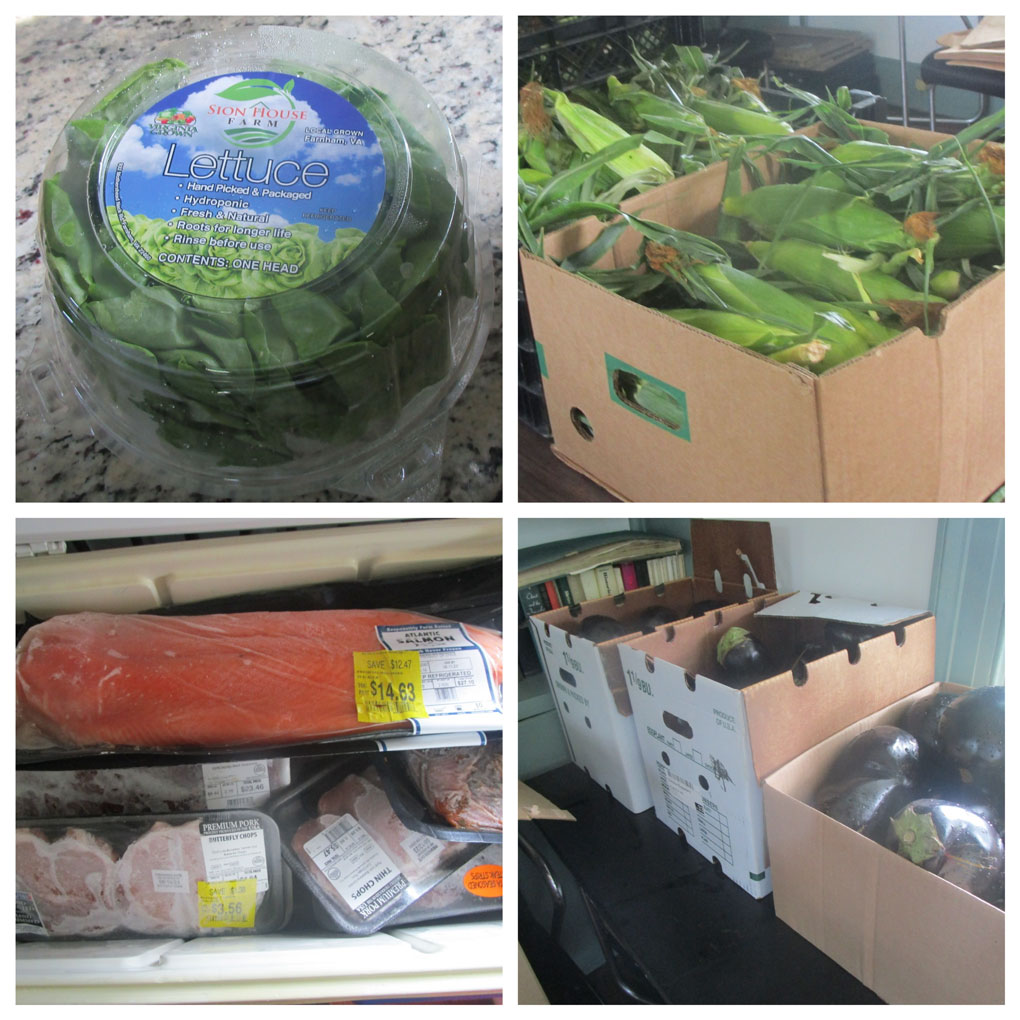
FOOD TYPES

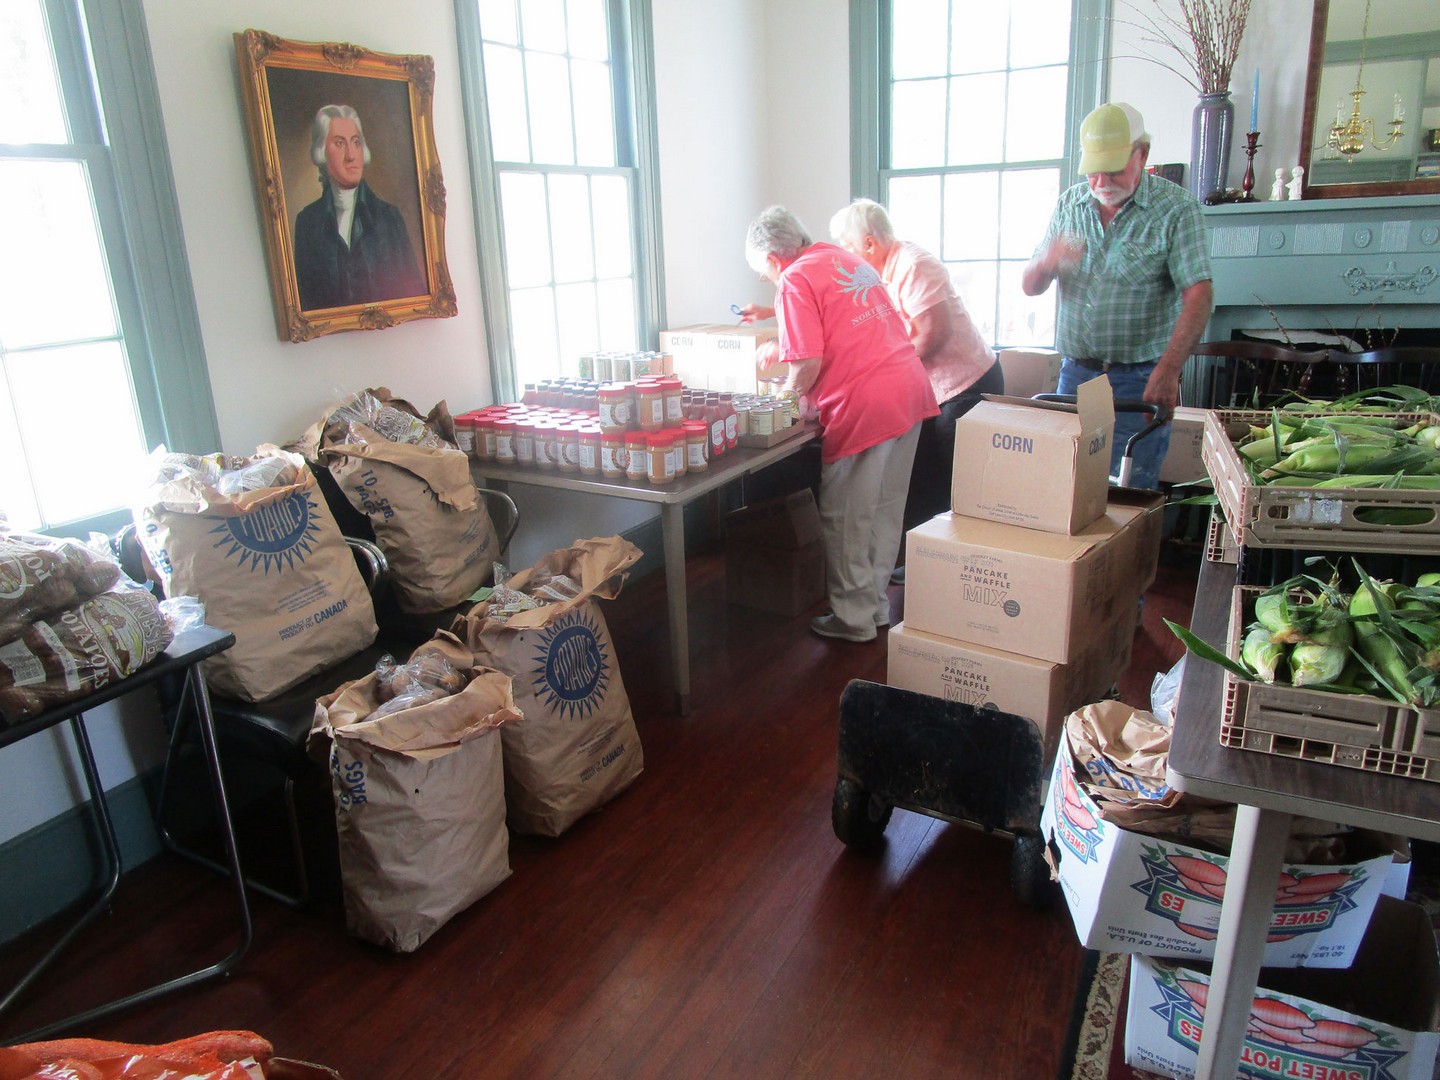
In terms of supply, there was a smaller percentage of produce 41% in July vs. 45% in June.  However, it was a larger percentage than a year ago in July, 2022. In July, 2022, it was 34% produce.
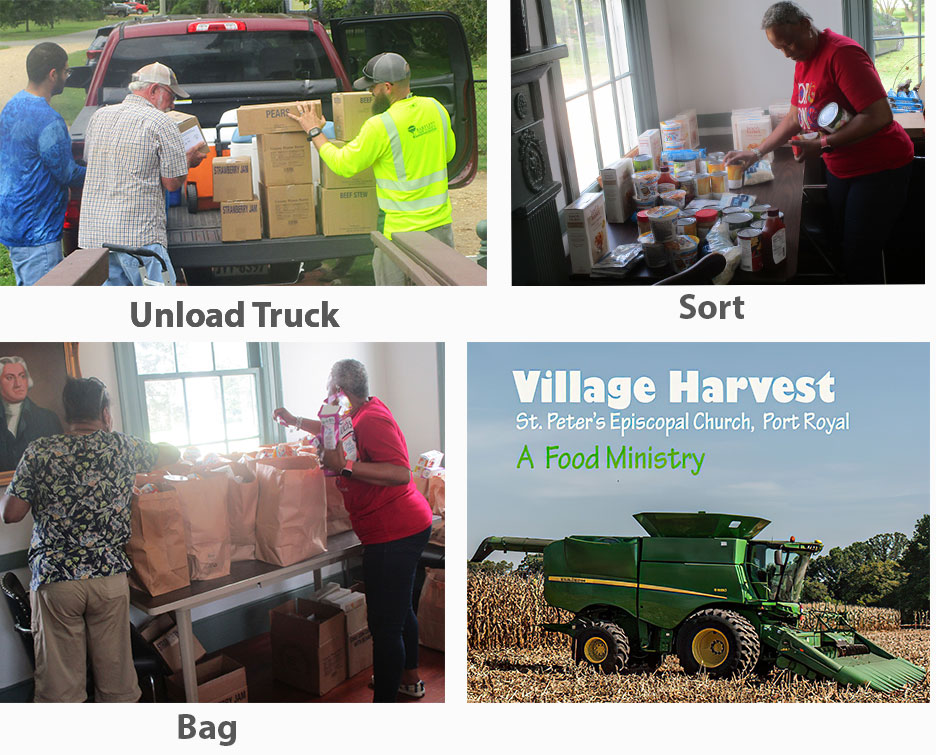
OTHER

Cookie bought can openers for those who requested them. We are keeping a list of those who requested to make sure sure they will get them if they were not there in July.

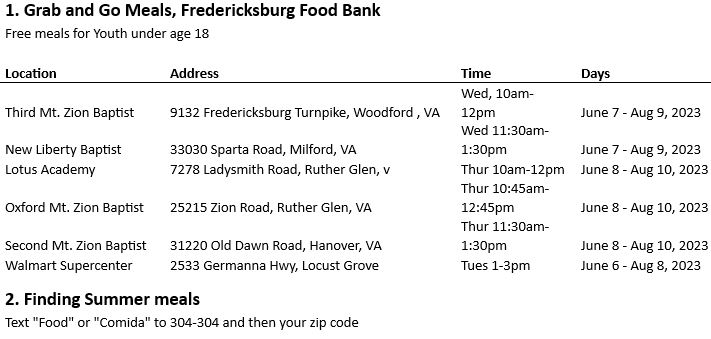
The Free Lance-Star had an additional article recently on other food sources. We have had our “Grab and Go” meals list plus a texting method of finding summer meals

Village Harvest, June 2023 – higher quarter, lower year to date

Quarter 2, 2023, served more people compared to the same quarter 2020-2022. 262 were served compared to 247 and 240 in 2022 and 2021, respectively (2020 was the Pandemic).

However, due to lower turnout in quarter 1, year to date figures through 6 months 2023 were lower than in the previous 2 years. This year we have served 480 clients compared to 543 and 535 in 2022 and 2021, respectively. Additionally, June 2023 was low at 65 compared to 93 last month. It was the lowest monthly since January’s 60.

The amount of the food available for quarter 2 also exceeded earlier quarter 2 periods from previous years. Quarter 2 we had 3,457 pounds available compared to 3,394 and 3,322 in 2022 and 2021, respectively. However, there was lower year to date food. Year to date was 6,370 pounds as of June, 2023 compared to 7,590 and 7,664 in 2022 and 2021 respectively.

An important statistic is food per client expressed in pounds. Year to date it is 13.30 pounds per client compared to 13.98 in 2022 and 14.33 in 2021, a declining trend. One positive is that it continues to exceed most years from 2016-2019. We served more clients in those earlier years, but the pounds per client was lower.

We provided a handout to all our clients with additional food locations:

Mixture of foods. Catherine with the new handout, Papaya

Village Harvest Prep Work

This is an example of the work that goes on behind the scenes. This happens to be May, 2023. One group goes to the Health Harvest Food Bank in Montross on the Tuesday before the Wednesday, Village Harvest to obtain the food. A separate team is waiting at St. Peter’s on this other team to return. This second group unloads the boxes, opens them, sorts and creates boxes for each client receiving food.

(full size gallery)

Village Harvest, Quarterly Data ending March 31, 2023

Date People Food Pounds Per Person
3/31/2021 295 4342 14.7
6/30/2021 240 3322 13.8
9/30/2021 188 3312 17.6
12/31/2021 276 3327 12.1
3/31/2022 296 4196 14.2
6/30/2022 247 3394 13.7
9/30/2022 251 3258 13.0
12/31/2022 257 4454 17.3
3/31/2023 218 2913 13.4

As of March, 2023 there was a decline in clients from the previous quarter (Dec. 2022) of (39) and first decline since the quarter ending June 2022. The previous quarter saw an increase in clients by 6 people in contast. We began 2023 coming off a 5% increase in 2022 and increase in clients by 52. This quarter was represented a (6.5%) decline in clients.

Food also declined in pounds by (1,541) pounds compared to an increase of 1,196 in the previous quarter. The decline was (30%).

So why the shift in numbers ? Some possibilities. Some people didn’t need assistance or found other support. Possibly the Wednesday wasn’t convenient.

The accounting firm Deloitte writes close to the idea that fewer people required assistance. “Currently, however, the US economy is surprisingly healthy, given that it is coming off of a global pandemic, severe supply chain issues, and a war affecting a key global energy supplier. Labor market conditions alone provide a lot of support for the idea that the economy can achieve the desired soft landing (and, despite claims to the contrary, soft landings are not that unusual).2 Inflation remains a concern, but much less of one than it was a year ago. “

The Supplemental Nutrition Assistance Program’s (SNAP) emergency allotments (EAs) — temporary benefit increases that Congress enacted to address rising food insecurity and provide economic stimulus during the COVID-19 pandemic were still going on this quarter. However, these benefits will be ending with the quarter’s end. The Center on Budget and Policy Priorities writes. ” This will result in a benefit cut for every SNAP household in the jurisdictions that still are paying EAs ― 32 states, the District of Columbia, Guam, and the U.S. Virgin Islands.[1] Every household in those states will receive at least $95 a month less; some households, who under regular SNAP rules receive low benefits because they have somewhat higher, but still modest incomes, will see reductions of $250 a month or more. The average person will receive about $90 a month less in SNAP benefits.” It will be interesting to see how this affects trends with the Village Harvest in the second quarter.

Honoring Women’s leadership on International Women’s Day

March 8 is International Women’s Day/ https://www.internationalwomensday.com “Celebrating women’s achievements and increasing visibility, while calling out inequality, is key.” “Collective action and shared ownership for driving gender parity is what makes International Women’s Day impactful.”

Let’s call out the achievements of women at St. Peter’s:

At St. Peter’s our key ministries are led by women. Andrea Pogue (Village Dinner, Village Harvest, Shred It, Sacred Ground, Jamaica mission), Cookie Davis (Buildings and Grounds, Sacred Ground as well as her work with historic Port Royal), Susan Linne von Berg (Village Dinner), Elizabeth Heimbach (ECW). BJ Anderson (Altar – Communion Bread), Jan Saylor (the above and anything creative), Denise Gregory (music) and Mary Peterman(music,art). One other lady to cite – Eunice Key who has moved to SC but who worked in most of the above ministries and named the Village Harvest and is in the collage. Diligent, hard working with abundant initiative to go along with it. Without them there would be a big gap.

Village Harvest, Feb. 2023

The pace has been slower in the first 2 months of 2023. The chart illustrates this summary over 3 years with fewer clients combined with a smaller food distribution:

Feb’s total clients were 77 above Jan 60. Food distributed was also lower at 836 pounds vs. 1,137 for Jan. Feb’s total represented the lowest pounds distributed since Sept. 2021