A sermon by the Rev. Evan Garner highlighted why Church food ministries are so important in our time:
“Because feeding them is our job. As followers of Jesus, it is our calling to feed these people, indeed to feed all hungry people. The kind of people who left their homes to walk out into the wilderness and hike up a mountain to see Jesus are the kind of people who were desperate to be fed. Some of them may not have needed physical nourishment, but most of them did. For most of them, their spiritual crisis was born out of an economic crisis. We know that because usually the kind of people who had enough on their own weren’t very interested in Jesus. The rich and the powerful ignored him or laughed at him or, sometimes, plotted against him.”
“It is our job as the leaders of the church, as the stewards of the resources entrusted to us by God and by our parish, to count costs and estimate resources. But it is never our job as the people of God to allow an attitude of scarcity to overcome a theology of abundance. “
The Village Harvest addresses the Food Insecurity issue in surrounding counties and is one our key ministries. The definition of Food insecure is “those households who not have access, at all times, to enough food for an active, healthy life for all household members.”
Food insecurity is a public health concern and associates with poor health particularly diabetes and increased health care costs.
Map the Meal Gap
Map the Meal Gap is an annual study conducted by Feeding America to help understand how food insecurity and food costs vary at the local level.
We cover the 4 county region – Caroline, Essex, Westmoreland, and King Goerge with the Village Harvest.
Overall there was a welcome decline in the meal gap of between (.40% and 1.2% from 2020 to 2021. In contrast, there was an increase of .40% for Virginia between 2020 and 2021.
% Food insecurity
|
County |
2020 |
2021 |
Change |
|
Caroline |
7.40% |
6.70% |
-0.70% |
|
Essex |
11.00% |
9.80% |
-1.20% |
|
Westmoreland |
10.70% |
9.90% |
-0.80% |
|
King George |
5.60% |
5.20% |
-0.40% |
|
|
|
|
|
Virginia as a whole |
7.70% |
8.10% |
0.40% |
Non-Food stats – Economic drivers of Food insecurity (updated 2022)
|
Caroline |
Essex |
Westmoreland |
King George |
Virginia |
|
|
Poverty Rate |
13.1% |
13.4% |
11.1% |
5.6% |
11.0% |
|
Unemployment |
4.4% |
4.8% |
4.6% |
4.2% |
4.0% |
|
Homeownership |
77.7% |
71.4% |
77.3% |
73.2% |
65.3% |
We need to review non-food stats to see what else is affecting potential clients. These are the economic drivers of food insecurity.
Poverty rates for the area counties except King George exceed that of Virginia. Caroline, as an example is 13.1% only exceeded by Esses at 13.4%. The Virginia figure is 11%. A similar trend is seen in unemployment with Caroline at 4.4%, Essex 4.8% compared to Virginia at 4.0%. With this statistic, King George at 4.2% is also worse than Virginia.
Income inequality is a related issue (inequality.org). Between 1979 and 2019, the average income of the richest 0.01 percent of households, a group that today represents about 31,500 people, grew more than nine times as fast as the income of the bottom 20 percent of earners. This trend would affct the next item.
According to Feeding America, 72% of the households served by its affiliated food banks live at or below 100% of the federal poverty line and have a median annual household income of $9,175. In short, they don’t have enough money to consistently put food on the table.
Poverty and unemployment for the US as a whole are higher at 13.4% and at 4.4% higher than Virginia, respectively. The local county rates are close to US statistics as a whole.
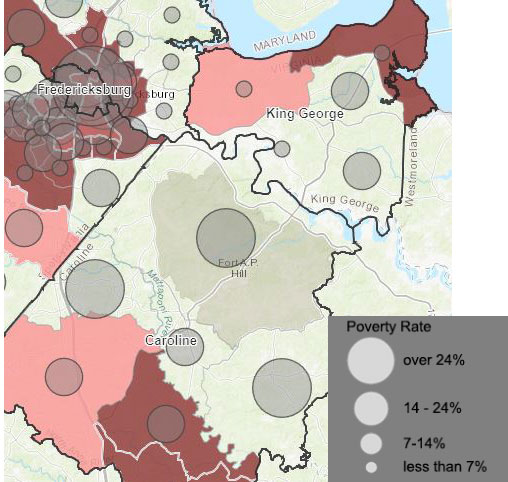
There is a “poverty circle” just south of Port Royal in the direction of Fort A.P. Hill (map from Virginia Community Food Connections):

Change in Drivers
Feeding America estimates that a 1% increase in the poverty rate leads to a .26% increase in the overall food insecurity rate.
They also estimate that a 1% increase in the unemployment rate leads to a .50% increase in the overall food insecurity rate.
Finally a 1% increase in the homeownership rate leader to 0.09% decrease in the overall food insecurity rate.
One positive is that homeownership over 70% for all four counties is better than Virginia at 65.3%.
