Quarter 2, 2023, served more people compared to the same quarter 2020-2022. 262 were served compared to 247 and 240 in 2022 and 2021, respectively (2020 was the Pandemic).
However, due to lower turnout in quarter 1, year to date figures through 6 months 2023 were lower than in the previous 2 years. This year we have served 480 clients compared to 543 and 535 in 2022 and 2021, respectively. Additionally, June 2023 was low at 65 compared to 93 last month. It was the lowest monthly since January’s 60.
The amount of the food available for quarter 2 also exceeded earlier quarter 2 periods from previous years. Quarter 2 we had 3,457 pounds available compared to 3,394 and 3,322 in 2022 and 2021, respectively. However, there was lower year to date food. Year to date was 6,370 pounds as of June, 2023 compared to 7,590 and 7,664 in 2022 and 2021 respectively.
An important statistic is food per client expressed in pounds. Year to date it is 13.30 pounds per client compared to 13.98 in 2022 and 14.33 in 2021, a declining trend. One positive is that it continues to exceed most years from 2016-2019. We served more clients in those earlier years, but the pounds per client was lower.
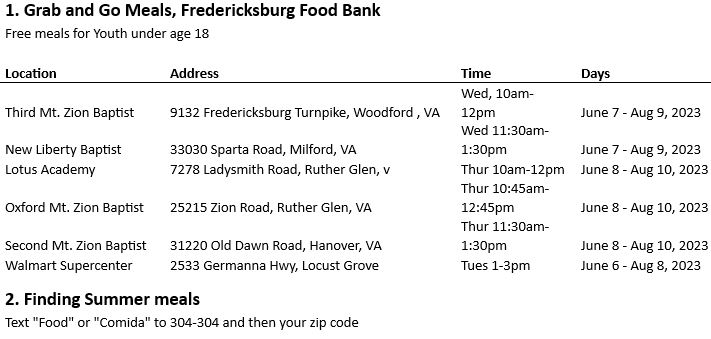
We provided a handout to all our clients with additional food locations:


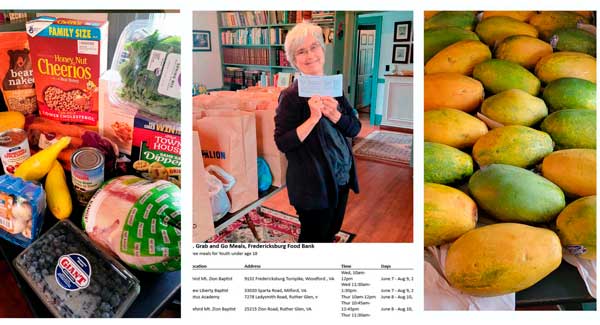
Mixture of foods. Catherine with the new handout, Papaya
