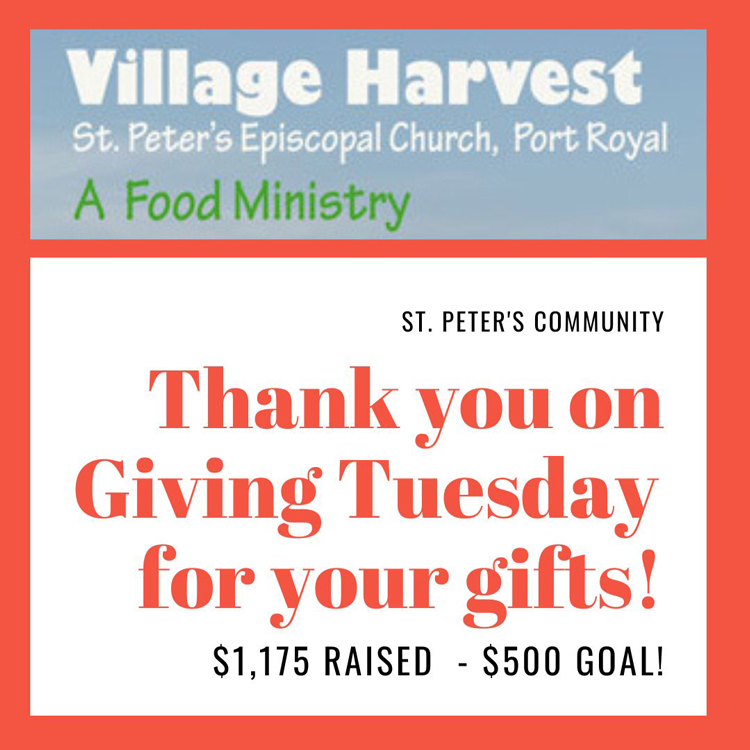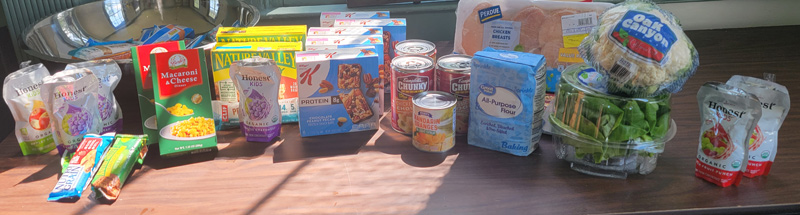
Bring a can, or cans, of soup to church on the 11th, along with a Valentine’s Day card wishing the recipient love from St Peter’s to be included in a Village Harvest bag on Wed, February 21st. The goal—thirty cans of soup and thirty cards for those who come to the distribution. Monetary donations to the Village Harvest are always welcome. Write a check to St Peter’s with Village Harvest in the memo line if you wish to donate.
Why give ?
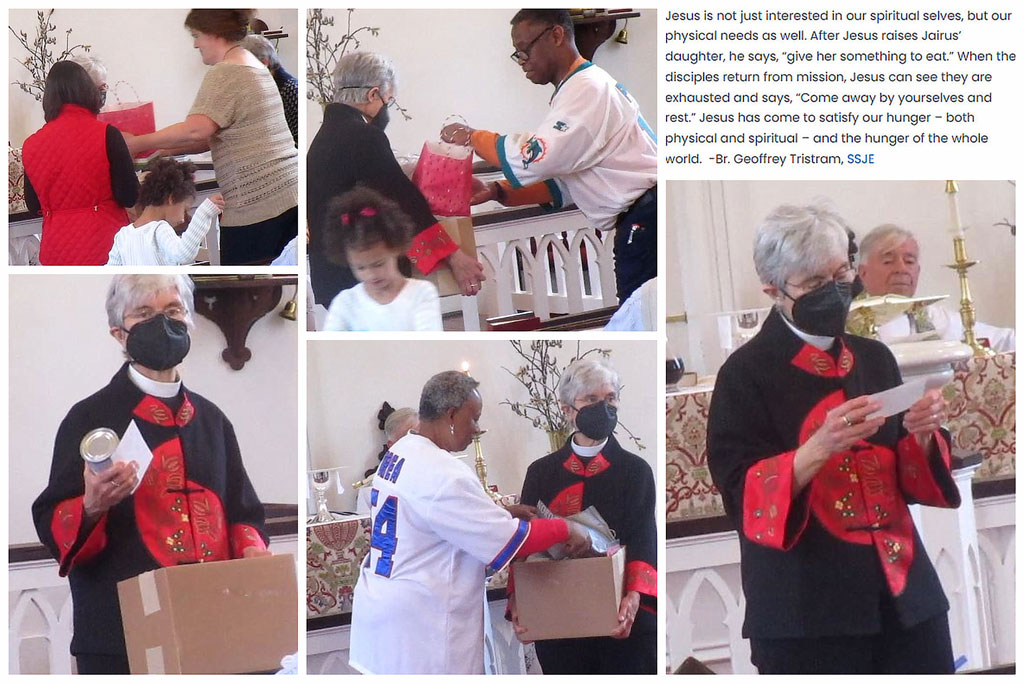
A sermon by the Rev. Evan Garner highlighted why Church food ministries are so important in our time:
“Because feeding them is our job. As followers of Jesus, it is our calling to feed these people, indeed to feed all hungry people. The kind of people who left their homes to walk out into the wilderness and hike up a mountain to see Jesus are the kind of people who were desperate to be fed. Some of them may not have needed physical nourishment, but most of them did. For most of them, their spiritual crisis was born out of an economic crisis. We know that because usually the kind of people who had enough on their own weren’t very interested in Jesus. The rich and the powerful ignored him or laughed at him or, sometimes, plotted against him.”
“It is our job as the leaders of the church, as the stewards of the resources entrusted to us by God and by our parish, to count costs and estimate resources. But it is never our job as the people of God to allow an attitude of scarcity to overcome a theology of abundance. “
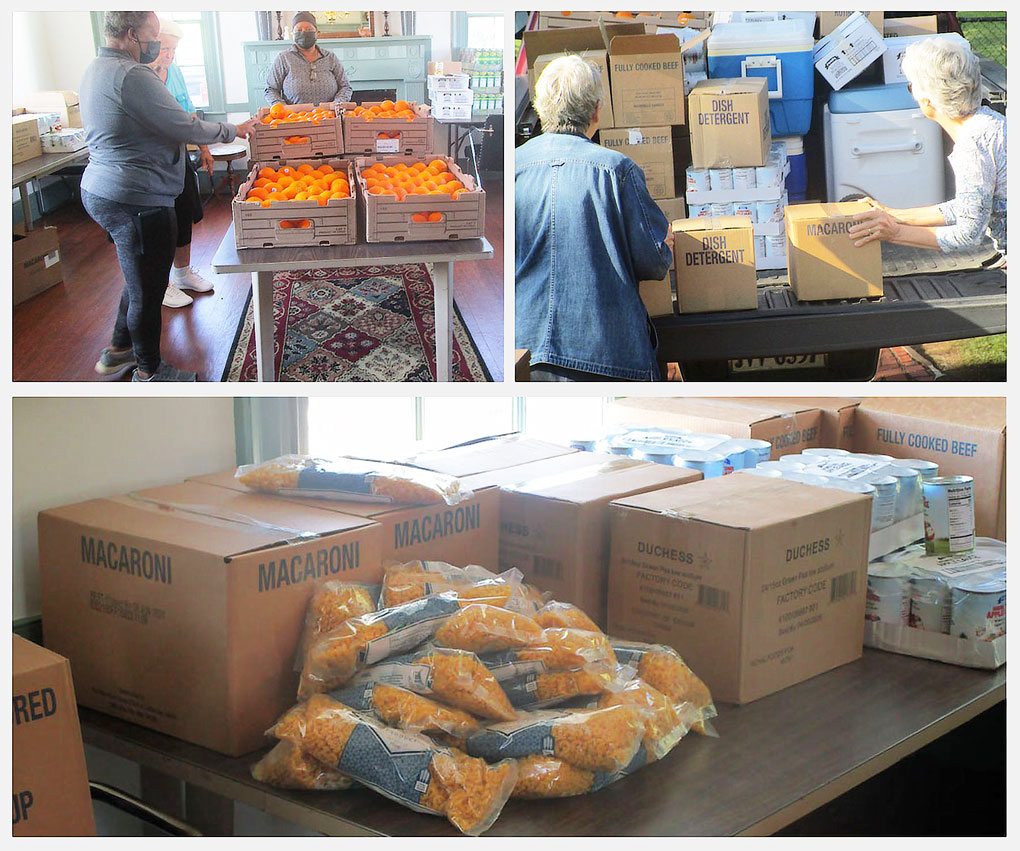
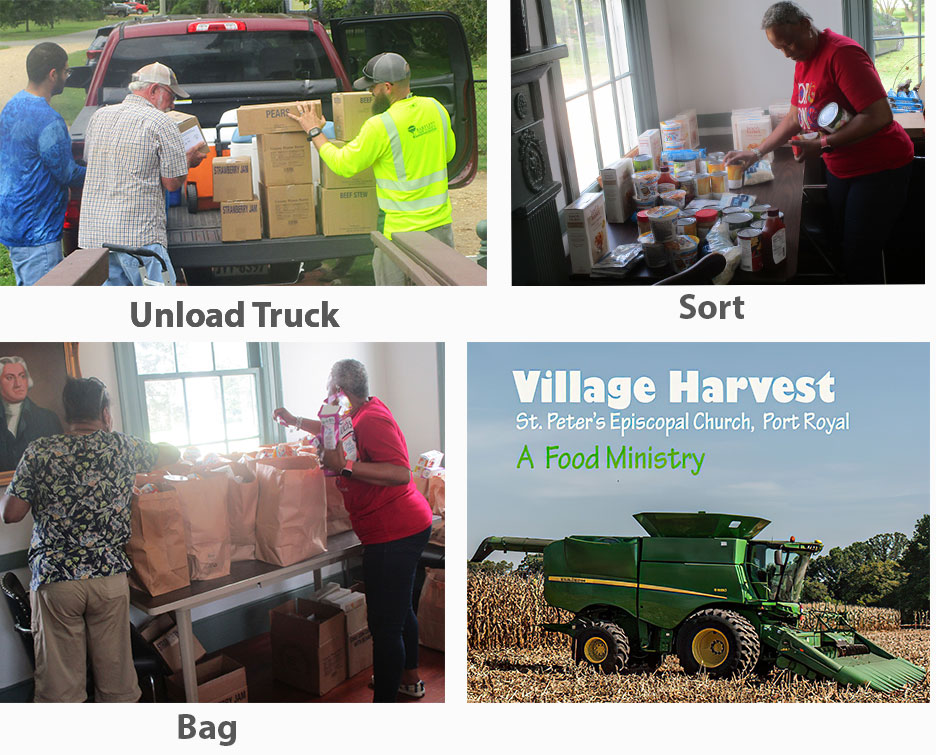
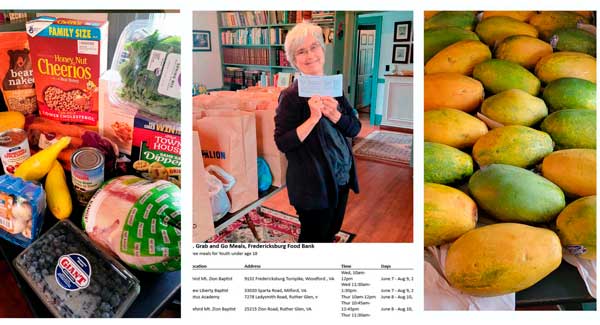
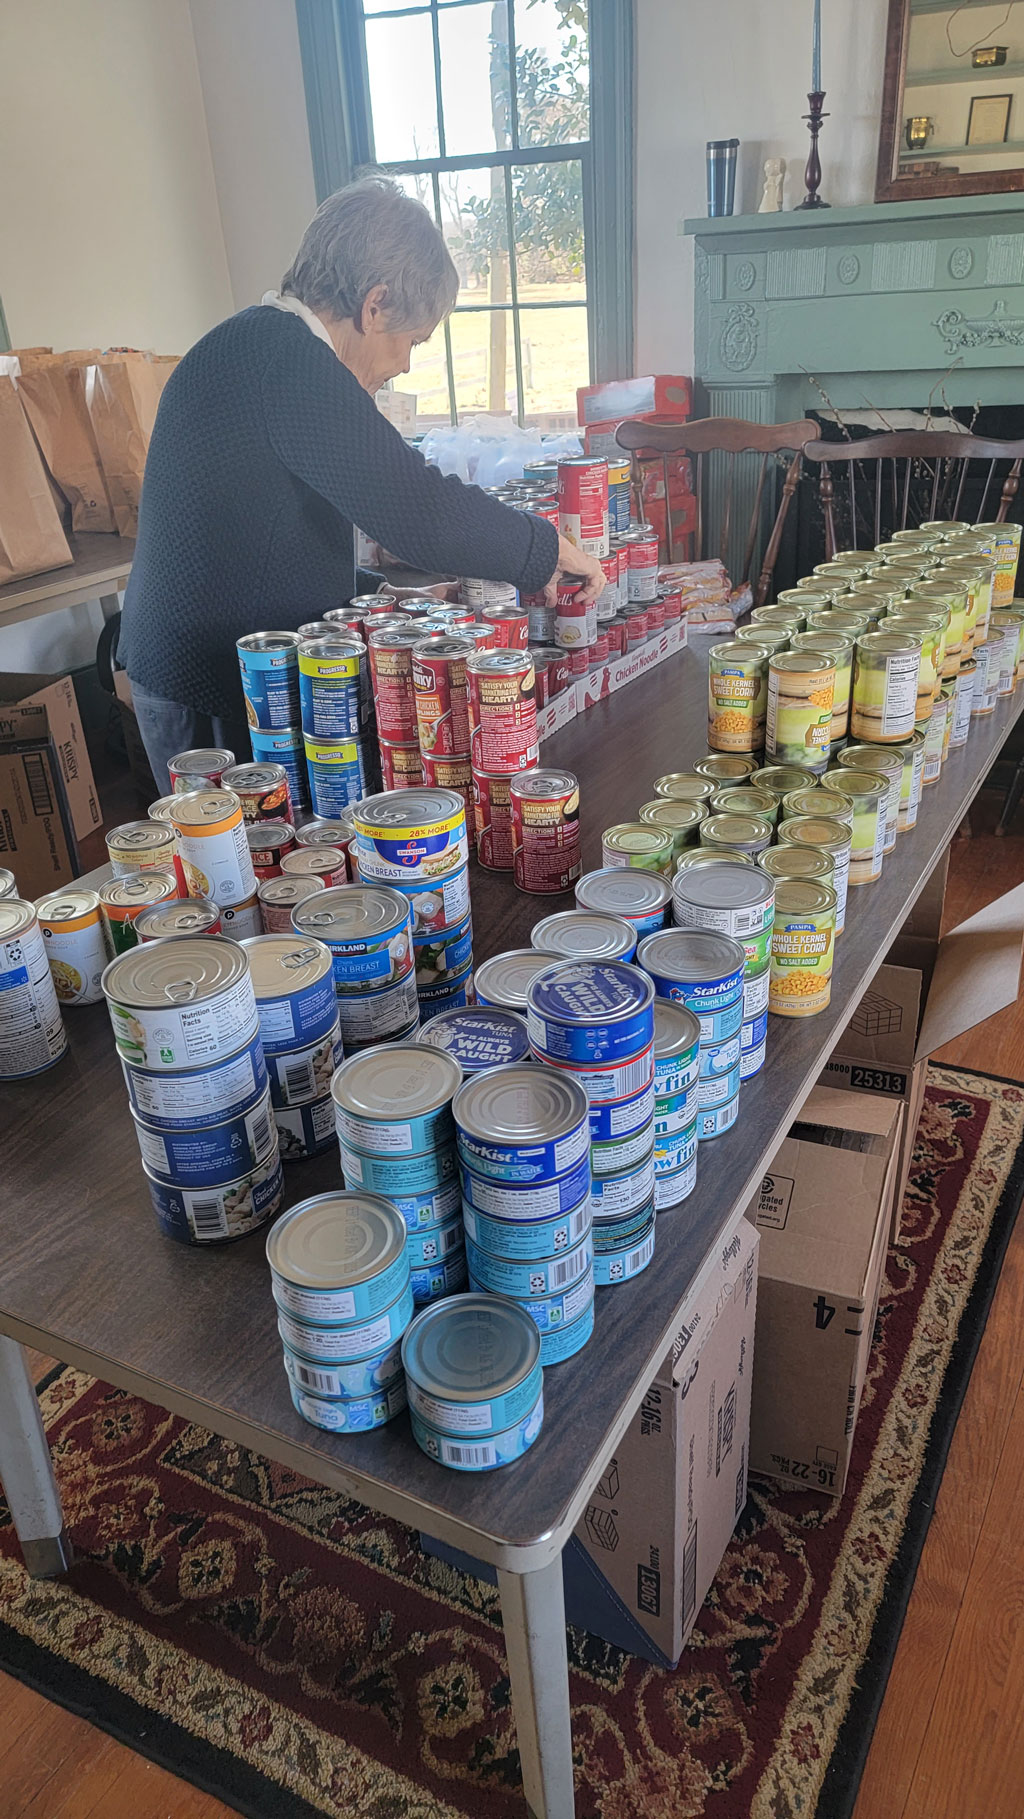
The Village Harvest addresses the Food Insecurity issue in surrounding counties and is one our key ministries. The definition of Food insecure is “those households who not have access, at all times, to enough food for an active, healthy life for all household members.”
Food insecure is not the same as poverty. Many of those in poverty are not food insecure though poverty is one cause of food insecurity.
There is a “poverty circle” just south of Port Royal in the direction of Fort A.P. Hill (map from Virginia Community Food Connections):
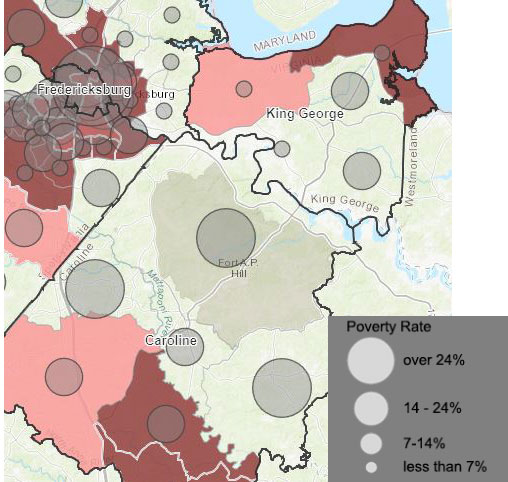
Food insecurity is associated with numerous adverse social and health outcomes and is increasingly considered a critical public health issue. Key drivers of food insecurity include unemployment, poverty, and income shocks, which can prevent adequate access to food. Figures for food insecurity are expressed as a percentage of the population.
Here is the data for the local counties which we serve from Feeding America and the percentage of those who are food insecure. There have been significant improvements in all counties since 2017 except for Westmoreland. Half of the local area is still above Virginia in food insecurity which we would like to reverse:
|
2020 |
2017 |
| County |
% |
% |
| Caroline |
7.4% |
11.3% |
| Essex |
11.0% |
14.0% |
| Westmoreland |
10.7% |
10.8% |
| King George |
5.6% |
8.1% |
|
|
|
| Virginia as a whole |
7.7% |
10.2% |
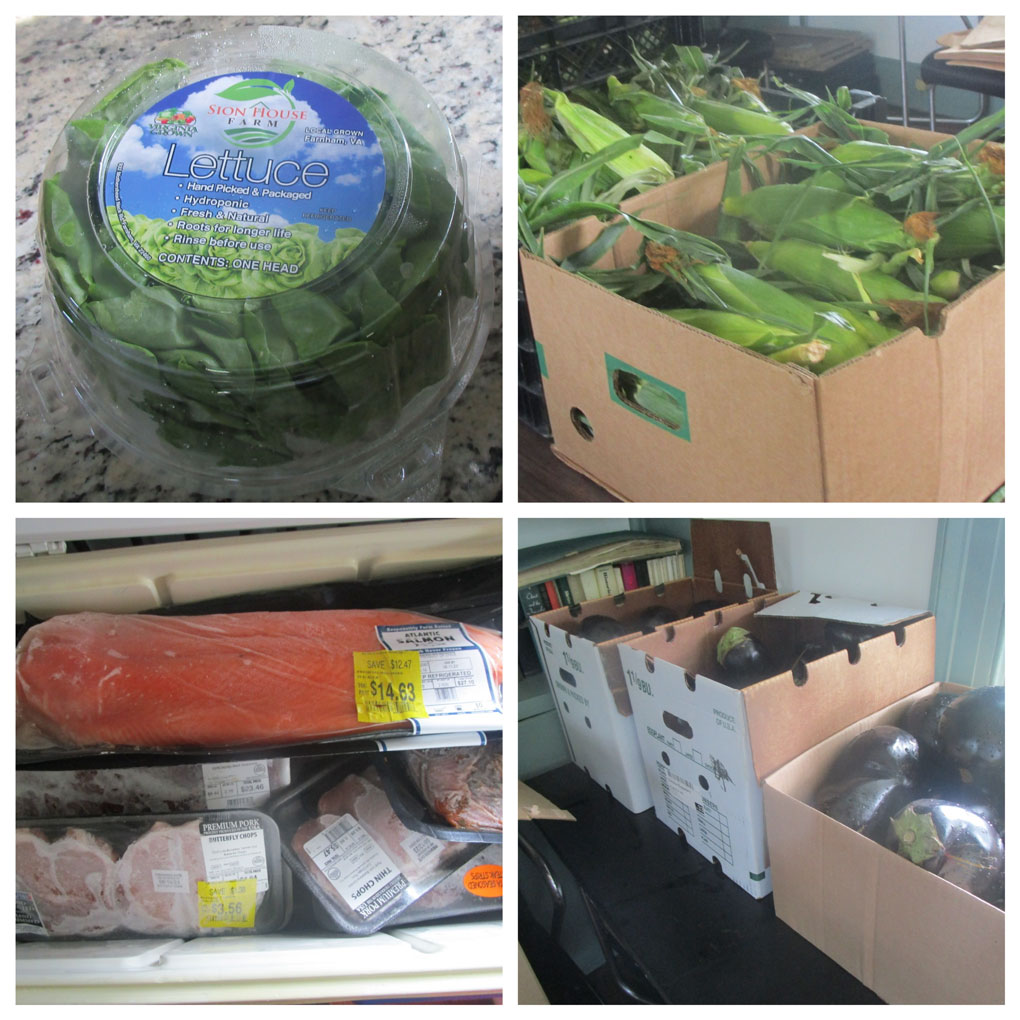
St. Peter’s spends about $2000 a year on food purchased from the Healthy Harvest Food Bank for the Village Harvest. Please give generously this Sunday. Thanks!